Bankinter maintained its growth in a year of a general contraction in lending, particularly with individual customers, who were hit by the increase in interest rates, reducing activity in the housing market and demand for mortgages. Household and company income performed well during the year, enabling customers to face the increased financial burdens of higher interest rates, keeping the non-performing loans ratio under control.
Loans and advances to customers at amortised cost increased by 3.4% and eligible exposures (which include off-balance-sheet exposures) increased by 4.2%. Underperforming loans fell by 4.2% as the effects of the health and energy crises on the sectors dissipated.
Non-performing exposure increased by 4.5% taking the non-performing loans index to 2.11%, an increase of 1 basis point, i.e. 0.3%. This is 67% of the sector average in Spain (3.57% according to Banco de España data from November 2023). Provisions for credit risk rose by 1.9% during the year, as detailed in Note 44 of the Consolidated Legal Report. The balance of foreclosed assets decreased by 30.6% in the year to 85 million euros at 31 December 2023, equal to 0.1% of total credit risk.
| Asset quality – Credit risk | ||||
|---|---|---|---|---|
| Thousands of euros | 31/12/2023 | 31/12/2022 | Change | % |
|
Eligible exposures |
85,922,011 |
82,426,636 |
3,495,375 |
4.2 |
|
Stage 1 (Performing loans) |
81,376,831 |
77,840,753 |
3,536,079 |
4.5 |
|
Stage 2 (Underperforming exposures) |
2,732,427 |
2,851,278 |
(118,851) |
(4.2) |
|
Stage 3 (Non-performing exposures) |
1,812,753 |
1,734,606 |
78,148 |
4.5 |
|
Credit risk allowances and provisions |
1,172,598 |
1,150,700 |
21,898 |
1.9 |
|
Stage 1 (Performing loans) |
148,801 |
175,134 |
(26,333) |
(15.0) |
|
Stage 2 (Underperforming exposures) |
105,488 |
108,039 |
(2,552) |
(2.4) |
|
Stage 3 (Non-performing exposures) |
918,310 |
867,527 |
50,783 |
5.9 |
|
NPL ratio (%) |
2.11 |
2.10 |
0.01 |
0.3 |
|
Non-performing loan coverage ratio (%) |
64.69 |
66.34 |
(1.65) |
(2.5) |
|
Foreclosed assets |
85,253 |
122,865 |
(37,612) |
(30.6) |
|
Provision for foreclosed assets |
54,475 |
68,813 |
(14,338) |
(20.8) |
|
Foreclosure coverage (%) |
63.90 |
56.01 |
7.89 |
14.1 |
Following is a description of the trend and main figures for eligible exposures in Spain arranged by internal business sectors:
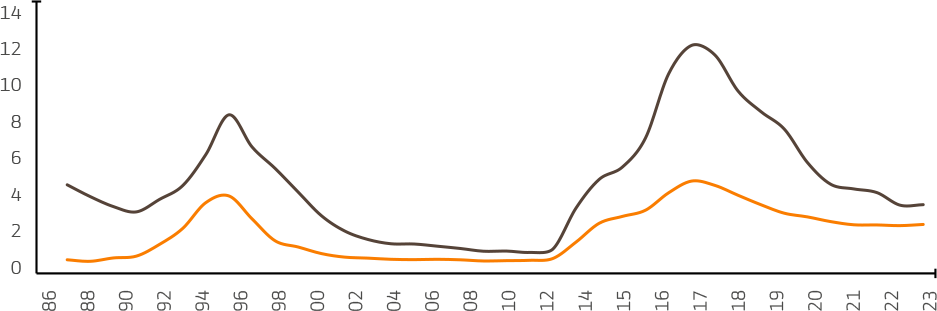
Sector data: Banco de España, November 2023
We use first and third-party cookies for analytical and statistical purposes and to show you personalised advertisements based on a profile compiled from your browsing habits (e.g. pages visited). For more information, click on our Cookie Policy. You can accept all cookies by pressing 'Accept' or personalise your choice by clicking on MANAGE OR REJECT COOKIES.