Results

Bankinter’s commercial efforts in a year of strong economic recovery, such as 2021, brought the Group record results. This demonstrates Bankinter’s financial strength, the consistency of its value proposition and the potential of some of its lines of business that are starting to thrive and become increasingly diversified.
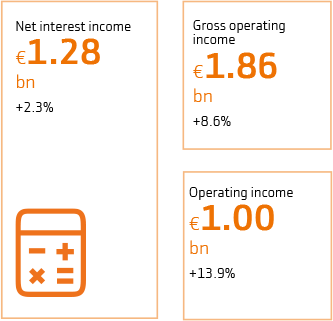
All margins experienced strong growth, with the pre-provision operating profit reaching record figures: 1.0021 billion euros, 13.9% more than in 2020 and 19% more than in 2019, that is, before the outbreak of the pandemic.
Net profit amounted to 1.3331 billion euros, including the capital gain of 895.7 million euros generated by the successful IPO of Línea Directa Aseguradora (LDA). Excluding this capital gain, the Group's recurring net profit stood at 437.4 million euros (+37.9%).
As a result, Bankinter achieved a CAGR for profit after tax of 15% between 2012 and 2021, despite the low level of earnings in 2020 caused by extraordinary provisions.
Return on Equity (ROE). Without taking into account the capital gain from LDA, this stood at 9.6%, compared to 7.03% in 2020, which was the year in which this ratio suffered from the higher provisions made to prevent the macroeconomic environment from worsening due to the health crisis.
Capital. The Bankinter capital maintains a CET1 fully-loaded ratio (of the highest quality) of 12.1%, well above the requirements of the European Central Bank, set at 7.68%.
Non-performing loans. As at 31 December, the non-performing loans ratio stood at 2.24%, down 13 basis points from the year-earlier figure, with little impact from the end of the mortgage moratoriums. The non-performing loan coverage ratio was 63.56%, an improvement of 302 basis points from year-end 2020.
Liquidity. Bankinter has a negative customer funding gap, with a deposit-to-loan ratio of 108.5%.
Margins
The stronger commercial activity boosted margins, which in all cases were not just higher than in 2020, but also than in 2019, enabling the Bank to post record revenue figures.
The diversity of the source of revenue and the fact that our business includes activities that have already been consolidated along with new activities, with much greater potential, means we can predict strong figures in future, which will compensate for LDA leaving the Group.
Net interest income. Closed the year at 1.2753 billion euros, up 2.3% from 2020, driven by higher volumes and price optimisation, even amid low interest rates.
Gross operating income. Up 8.6% from one year ago, reaching 1.8553 billion euros. Revenue from commissions already represents 33% of this margin and totals 603 million (+21%). The bulk of these fees and commissions come from the asset management, brokerage and customer advisory business, all high value-added services.
Operating profit. This figure, before taxes, exceeded 1 billion euros for the first time in the bank's history, standing at 1.0021 billion (+13.9% compared to 2020 and +19% compared to 2020), with operating costs growing to 3%.
Businesses
Bankinter ended 2021 with excellent results in commercial activity in all types of products and businesses and in all markets where it is present.
Companies. Loans and receivables amounted to 28,700 million euros, with the portfolio in Spain increasing by 1%, compared with a 1.4% contraction in the sector until November. This improvement was achieved despite the absence of ICO-backed loans, which were very important in 2020. Bankinter's market share increased from 5.3% to 5.4%.
Commercial Retail Banking. Strong growth in all customer segments. The Private Banking assets under management amounted to 49.9 billion euros, compared to 42.8 billion in 2020, with 3.6 billion in net new assets. In Retail Banking, growth has been driven by magnificent customer acquisition figures of 107,503 customers, up 20% on the previous year. All commercial retail banking products performed positively. The balance for salary accounts in Spain increased from 12,700 million euros to 14,900 million euros. 2021 was one of the best years ever for Bankinter's mortgage business, with new loans (including EVO Banco) amounting to 5,900 million euros, a 58% increase on the previous year. The mortgage portfolio totalled 31,300 million euros at 31 December, with 8.6% growth in Spain, compared to 1.3% for the sector as a whole, according to figures to November from the Banco de España.
Balance sheet
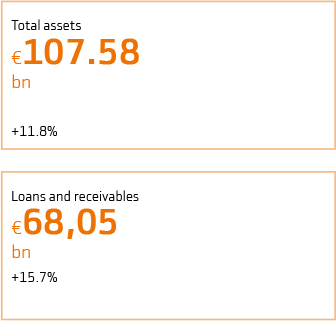
Total assets closed 2021 at 107.5841 billion euros (+11.8%), while customer loans and receivables grew to 68.0488 billion (+5.7%) and retail funds reached 72.4849 billion (+11.7 %).
In Spain, the increase in loans and receivables was 3.9% and that of retail funds was 10.8%, compared to -0.3% and +4.9% for the banking system as a whole, according to data from November.
Asset Management. The bank's commercial and advisory activity resulted in a 26.9% increase in off-balance-sheet managed funds compared to 2020, to 39,533.6 million euros. The improvement was especially significant in investment funds, both proprietary and third party, which increased by 30% to 29,800 million euros, with some products being among the most profitable in their categories.
Investment banking. Bankinter Investment, the company responsible for investment banking, has become a benchmark for activities such as alternative investment. It has launched 16 investment vehicles in a wide range of economic sectors, attracting 3,200 million euros of capital from more than 3,000 private banking and institutional customers. The balance for structured financing stands at 4,000 million euros. As a result, Bankinter Investment's gross operating income increased to 187 million euros, from 116 million in 2020.
Bankinter Portugal. It made a pre-tax profit of 50 million euros, which is reflected in all of its business indicators and margins. The loan book grew by 6% to 6,900 million euros, while customer deposits increased by 23% to 5,900 million euros. Off-balance sheet assets under management increased by 22%, to 4,400 million euros. Net interest income was 99 million euros (+5%) while gross operating income was 152 million euros (+10%), due to the strong performance of fee income, at 61 million euros.

Bankinter Consumer Finance At 31 December. the consumer business brand had a loan book of 3,500 million euros (+23%), with 1,500 million in new production. Consumer loans accounted for 1,900 million euros, with the remainder relating to various types of cards and the mortgages marketed in Ireland. Activity in Ireland, through the Avant Money brand, expanded considerably in 2021, with 1,000 million euros in the loan book at year-end, of which 400 million euros was accounted for by new mortgages. The bank has already become a major player in this market, despite only having started this business there recently. Avant Money's NPL ratio is 0.6%.
EVO Banco. Evo is continuing to consolidate its position among the younger and digital customer segments, with 678,000 customers at year-end 2021 and loans and receivables of 1,860 million euros, compared to 1,224 million in 2020. New mortgages amounted to 729 million euros (395 million in 2020). This reflects the level of recovery caused by the digital bank in this business.
CONSOLIDATED BALANCE SHEETS AT 31 DECEMBER 2021 AND 2020 (Thousands of euros)
| ASSETS | 31.12.2021 | 31.12.2020 (*) |
|---|---|---|
| Cash, cash balances at central banks and other demand deposits | 22,373,090 | 15,044,317 |
| Financial assets held for trading | 4,038,256 | 2,158,742 |
| Derivatives | 342,071 | 498,922 |
| Equity instruments | 197,862 | 181,834 |
| Debt securities | 1,246,748 | 400,254 |
| Loans and advances | 2,251,575 | 1,077,732 |
| Central banks | - | - |
| Credit institutions | 2,251,575 | 1,020,568 |
| Customers | - | 57,164 |
| Memorandum items: loaned or pledged | 667,722 | 136,949 |
| Non-trading financial assets mandatorily at fair value through profit or loss | 131,316 | 119,555 |
| Equity instruments | 130,328 | 118,865 |
| Debt securities | 738 | 690 |
| Loans and advances | 250 | - |
| Central banks | - | - |
| Credit institutions | - | - |
| Customers | 250 | - |
| Memorandum items: loaned or pledged | - | - |
| Financial assets designated at fair value through profit or loss | - | - |
| Debt securities | - | - |
| Loans and advances | - | - |
| Central banks | - | - |
| Credit institutions | - | - |
| Customers | - | - |
| Memorandum items: loaned or pledged | - | - |
| Financial assets at fair value through other comprehensive income | 2,751,517 | 2,629,598 |
| Equity instruments | 304,893 | - |
| Debt securities | 2,446,624 | 2,629,598 |
| Loans and advances | - | - |
| Central banks | - | - |
| Credit institutions | - | - |
| Customers | - | - |
| Memorandum items: loaned or pledged | 868,516 | 560,373 |
| Financial assets at amortised cost | 76,285,363 | 72,861,812 |
| Debt securities | 7,595,987 | 7,579,330 |
| Loans and advances | 68,689,376 | 65,282,482 |
| Central banks | - | - |
| Credit institutions | 2,407,309 | 2,122,461 |
| Customers | 66,282,067 | 63,160,021 |
| Memorandum items: loaned or pledged | 7,095,267 | 4,303,136 |
| Derivatives - hedge accounting | 170,077 | 210,773 |
| Fair value changes of the hedged items in portfolio hedge of interest rate risk | 46,124 | 195,805 |
| Investments in joint ventures and associates | 169,971 | 109,526 |
| Joint ventures | 91,329 | 36,679 |
| Associates | 78,642 | 72,847 |
| Assets under reinsurance and insurance contracts | - | - |
| Tangible assets | 450,436 | 455,070 |
| Property, plant and equipment | 450,436 | 455,070 |
| For own use | 441,728 | 435,540 |
| Leased out under an operating lease | 8,708 | 19,530 |
| Assigned to welfare projects (savings banks and credit cooperatives) | - | - |
| Investment property | - | - |
| Of which: Leased out under operating leases | - | - |
| Memorandum items: Acquired under finance leases | 130,740 | 115,221 |
| Intangible assets | 269,685 | 258,075 |
| Goodwill | 2,276 | 2,276 |
| Other intangible assets | 267,409 | 255,799 |
| Tax assets | 638,444 | 380,085 |
| Current tax assets | 364,636 | 110,053 |
| Deferred tax assets | 273,808 | 270,032 |
| Other assets | 153,645 | 120,326 |
| Insurance contracts linked to pensions | - | - |
| Inventories | - | - |
| Other assets | 153,645 | 120,326 |
| Non-current assets and disposal groups classified as held for sale | 106,184 | 1,708,409 |
| TOTAL ASSETS | 107,584,108 | 96,252,093 |
The accompanying notes 1 to 52 and appendices I through VI attached hereto form an integral part of the consolidated balance sheet as at 31 December 2021.
(*) Presented for comparison purposes only.
| LIABILITIES AND EQUITY | 31.12.2021 | 31.12.2020 (*) |
|---|---|---|
| LIABILITIES | 102,731,948 | 91,287,936 |
| Financial liabilities held for trading | 3,696,496 | 1,382,300 |
| Derivatives | 438,795 | 440,711 |
| Short positions | 1,472,331 | 496,886 |
| Deposits | 1,785,370 | 444,703 |
| Central banks | - | - |
| Credit institutions | 245,677 | - |
| Customers | 1,539,693 | 444,703 |
| Debt securities issued | - | - |
| Other financial liabilities | - | - |
| Financial liabilities designated at fair value through profit or loss | - | - |
| Deposits | - | - |
| Central banks | - | - |
| Credit institutions | - | - |
| Customers | - | - |
| Debt securities issued | - | - |
| Other financial liabilities | - | - |
| Memorandum items: subordinated liabilities | - | - |
| Financial liabilities at amortised cost | 97,809,974 | 87,472,834 |
| Deposits | 87,995,644 | 78,028,886 |
| Central banks | 14,190,714 | 12,885,116 |
| Credit institutions | 3,026,174 | 2,072,639 |
| Customers | 70,778,756 | 63,071,131 |
| Debt securities issued | 7,689,865 | 7,623,285 |
| Other financial liabilities | 2,124,465 | 1,820,663 |
| Memorandum items: subordinated liabilities | 1,693,190 | 1,167,074 |
| Derivatives - hedge accounting | 275,264 | 482,033 |
| Fair value changes of the hedged items in portfolio hedge of interest rate risk | 1,957 | 38,775 |
| Liabilities under reinsurance and insurance contracts | - | - |
| Provisions | 419,911 | 438,511 |
| Pensions and other post-employment defined benefit obligations | 1,669 | 1,265 |
| Other long-term employee benefits | - | - |
| Pending legal issues and tax litigation | 136,609 | 100,098 |
| Commitments and guarantees given | 38,216 | 37,787 |
| Other provisions | 243,417 | 299,361 |
| Tax liabilities | 254,543 | 220,102 |
| Current tax liabilities | 139,054 | 90,490 |
| Deferred tax liabilities | 115,489 | 129,612 |
| Share capital repayable on demand | - | - |
| Other liabilities | 273,803 | 264,433 |
| Of which: welfare fund (savings banks and credit cooperatives only) | - | - |
| Liabilities included in disposal groups classified as held for sale | - | 988,948 |
| TOTAL LIABILITIES | 102,731,948 | 91,287,936 |
| Shareholders' equity | 4,736,621 | 4,816,054 |
| Capital | 269,660 | 269,660 |
| a) Paid up capital | 269,660 | 269,660 |
| b) Unpaid capital which has been called up | - | - |
| Memorandum items: uncalled share capital | - | - |
| Share premium | - | 1,184,265 |
| Equity instruments issued other than share capital | - | - |
| a) Equity component of compound financial instruments | - | - |
| b) Other equity instruments issued | - | - |
| Other equity | 6,162 | 7,482 |
| Retained earnings | 3,306,854 | 3,051,137 |
| Revaluation reserves | - | 4,806 |
| Other reserves | (12,092) | (14,778) |
| Reserves or accumulated losses of investments in joint ventures and associates | (12,092) | (14,778) |
| Other | - | - |
| (-) Treasury shares | (1,025) | (3,641) |
| Profit or loss attributable to owners of the parent | 1,333,108 | 317,123 |
| (-) Interim dividends | (166,046) | - |
| Accumulated other comprehensive income | 115,539 | 148,103 |
| Items that will not be reclassified to profit or loss | 57,602 | 6,200 |
| a) Actuarial gains or (-) losses on defined benefit pension plans | 3,272 | (976) |
| b) Non-current assets and disposal groups classified as held for sale | - | 7,176 |
| c) Share of other recognised income and expense of investments in joint ventures and associates | - | - |
| d) Fair value changes of equity instruments measured at fair value through other comprehensive income | 54,330 | - |
| e) Hedge ineffectiveness of fair value hedges for equity instruments measured at fair value through other comprehensive income | - | - |
| Fair value changes of equity instruments measured at fair value through other comprehensive income [hedged item] | - | - |
| Fair value changes of equity instruments measured at fair value through other comprehensive income [hedging instrument] | - | - |
| f) Fair value changes of financial liabilities at fair value through profit or loss attributable to changes in their credit risk | - | - |
| Items that may be reclassified to profit or loss | 57,937 | 141,903 |
| a) Hedge of net investments in foreign operations [effective portion] | - | - |
| b) Foreign currency translation | - | - |
| c) Hedging derivatives. Cash flow hedges [effective portion] | (452) | (962) |
| d) Fair value changes of debt instruments measured at fair value through other comprehensive income | 53,951 | 99,711 |
| e) Hedging instruments [not designated elements] | - | - |
| f) Non-current assets and disposal groups classified as held for sale | - | 37,550 |
| g) Share of other recognised income and expense of investments in joint ventures and associates | 4,438 | 5,604 |
| Minority interests [Non-controlling interests] | - | - |
| Accumulated other comprehensive income | - | - |
| Other items | - | - |
| TOTAL EQUITY | 4,852,160 | 4,964,157 |
| TOTAL EQUITY AND LIABILITIES | 107,584,108 | 96,252,093 |
| MEMORANDUM ITEMS: OFF-BALANCE-SHEET EXPOSURES | ||
| Loan commitments given | 15,963,920 | 16,985,633 |
| Financial guarantees given | 1,676,285 | 1,749,716 |
| Other commitments given | 8,405,185 | 7,028,444 |
The accompanying notes 1 to 52 and appendices I through VI attached hereto form an integral part of the consolidated balance sheet as at 31 December 2021.
(*) Presented for comparison purposes only.
CONSOLIDATED INCOME STATEMENTS FOR THE YEARS ENDED 31 DECEMBER 2021 AND 2020 (Thousands of euros)
| (Debit)/Credit | (Debit)/Credit | |
|---|---|---|
| 31.12.2021 | 31.12.2020 (*) | |
| Interest income | 1,446,347 | 1,385,745 |
| Financial assets at fair value through other comprehensive income | 58,164 | 71,069 |
| Financial assets at amortised cost | 1,273,523 | 1,275,012 |
| Other interest income | 114,660 | 39,664 |
| Interest expenses | (171,069) | (138,745) |
| Expenses on share capital repayable on demand | - | - |
| A) NET INTEREST INCOME | 1,275,278 | 1,247,000 |
| Dividend income | 20,611 | 19,032 |
| Share of the profit or loss of entities accounted for using the equity method | 33,368 | 28,766 |
| Fee and commission income | 787,772 | 631,565 |
| Fee and commission expenses | (184,313) | (134,805) |
| Gains or losses on derecognition of financial assets and liabilities not measured at fair value through profit or loss, net | 36,073 | 45,807 |
| Financial assets at amortised cost | 32,134 | 31,156 |
| Other financial assets and liabilities | 3,939 | 14,651 |
| Gains or losses on financial assets and liabilities held for trading, net | 16,559 | 6,017 |
| Reclassification of financial assets out of fair value through other comprehensive income | - | - |
| Reclassification of financial assets out of amortised cost | - | - |
| Other gains or losses | 16,559 | 6,017 |
| Gains or losses on non-trading financial assets mandatorily at fair value through profit or loss, net | 19,401 | 5,025 |
| Reclassification of financial assets out of fair value through other comprehensive income | - | - |
| Reclassification of financial assets out of amortised cost | - | - |
| Other gains or losses | 19,401 | 5,025 |
| Gains or losses on financial assets and liabilities designated at fair value through profit or loss, net | - | - |
| Gains or losses from hedge accounting, net | 12 | 63 |
| Exchange differences [gain or loss], net | 2,254 | (7,813) |
| Other operating income | 28,556 | 36,928 |
| Other operating expenses | (180,244) | (168,545) |
| Of which: compulsory transfers to welfare funds (only savings banks and credit cooperatives) | - | - |
| Income from assets under insurance and reinsurance contracts | - | - |
| Expenses from liabilities under insurance and reinsurance contracts | - | - |
| B) GROSS OPERATING INCOME | 1,855,327 | 1,709,040 |
| Administrative expenses | (775,417) | (753,281) |
| a) Staff expenses | (472,786) | (446,695) |
| b) Other administrative expenses | (302,631) | (306,586) |
| Depreciation and amortisation | (77,787) | (75,577) |
| Provisions or reversal or provisions | (182,835) | (204,766) |
| Impairment or reversal of impairment and gains or losses on modifications of cash flows of financial assets not measured at fair value through profit or loss or modification gains or losses, net | (263,071) | (425,429) |
| a) Financial assets at fair value through other comprehensive income | 166 | 567 |
| b) Financial assets at amortised cost | (263,237) | (425,996) |
| Impairment or reversal of impairment of investments in joint ventures and associates | - | - |
| Impairment or reversal of impairment on non-financial assets | (7,185) | (2,084) |
| Tangible assets | (1,142) | - |
| Intangible assets | (6,046) | (2,082) |
| Other | 3 | (2) |
| Gains or losses on derecognition of non-financial assets | (742) | (1,190) |
| Negative goodwill recognised in profit or loss | - | - |
| Profit or loss from non-current assets and disposal groups classified as held for sale not qualifying as discontinued operations | (11,581) | (16,174) |
| C) PROFIT OR LOSS BEFORE TAX FROM CONTINUING OPERATIONS | 536,709 | 230,539 |
| Tax expense or income related to profit or loss from continuing operations | (139,276) | (56,413) |
| D) PROFIT OR LOSS AFTER TAX FROM CONTINUING OPERATIONS | 397,433 | 174,126 |
| Profit or loss after tax from discontinued operations | 935,675 | 142,997 |
| E) PROFIT OR LOSS FOR THE PERIOD | 1,333,108 | 317,123 |
| Attributable to minority interests (non-controlling interests) | - | - |
| Attributable to the owners of the parent | 1,333,108 | 317,123 |
| EARNINGS PER SHARE: | ||
| Basic | 1.49 | 0.35 |
| Diluted | 1.46 | 0.33 |
The accompanying notes 1 to 52 and appendices I through VI attached hereto form an integral part of the consolidated income statement for the year ended 31 December 2021.
(*) Presented for comparison purposes only.
CONSOLIDATED STATEMENT OF RECOGNISED INCOME AND EXPENSE FOR THE YEARS ENDED 31 DECEMBER 2021 AND 2020 (Thousands of euros)
| 31.12.2021 | 31.12.2020 (*) | |
|---|---|---|
| A) PROFIT OR LOSS FOR THE PERIOD | 1,333,108 | 317,123 |
| B) OTHER COMPREHENSIVE INCOME | (32,564) | (39,518) |
| Items that will not be reclassified to profit or loss | 51,403 | 8,097 |
| a) Actuarial gains or (-) losses on defined benefit pension plans | 6,029 | 5,159 |
| b) Non-current assets and disposal groups held for sale | (9,567) | 9,567 |
| c) Share of other recognised income and expense of investments in joint ventures and associates | - | - |
| d) Fair value changes of equity instruments measured at fair value through other comprehensive income | 52,875 | (3,627) |
| e) Gains or (-) losses from hedge accounting of equity instruments at fair value through other comprehensive income, net | - | - |
| f) Fair value changes of equity instruments measured at fair value through other comprehensive income (hedged item) | - | - |
| g) Fair value changes of equity instruments measured at fair value through other comprehensive income (hedging instrument) | - | - |
| h) Fair value changes of financial liabilities at fair value through profit or loss attributable to changes in their credit risk | - | - |
| i) Income tax relating to items that will not be reclassified | 2,066 | (3,002) |
| Items that may be reclassified to profit or loss | (83,967) | (47,615) |
| a) Hedge of net investments in foreign operations [effective portion] | - | - |
| Valuation gains or (-) losses taken to equity | - | - |
| Transferred to profit or loss | - | - |
| Other reclassifications | - | - |
| b) Foreign currency translation | - | - |
| Translation gains or (-) losses taken to equity | - | - |
| Transferred to profit or loss | - | - |
| Other reclassifications | - | - |
| c) Cash flow hedges [effective portion] | 727 | (1,414) |
| Valuation gains or (-) losses taken to equity | 727 | (1,414) |
| Transferred to profit or loss | - | - |
| Transferred to initial carrying amount of hedged items | - | - |
| Other reclassifications | - | - |
| d) Hedging instruments [not designated elements] | - | - |
| Valuation gains or (-) losses taken to equity | - | - |
| Transferred to profit or loss | - | - |
| Other reclassifications | - | - |
| e) Debt instruments at fair value through other comprehensive income | (65,365) | (117,052) |
| Valuation gains or (-) losses taken to equity | (61,544) | (64,605) |
| Transferred to profit or loss | (3,821) | (6,544) |
| Other reclassifications | - | (45,903) |
| f) Non-current assets and disposal groups held for sale | (50,067) | 50,067 |
| Valuation gains or (-) losses taken to equity | (50,067) | 4,164 |
| Transferred to profit or loss | - | - |
| Other reclassifications | - | 45,903 |
| g) Share of other recognised income and expense of investments in joint ventures and associates | (1,166) | 65 |
| h) Income tax relating to items that may be reclassified to profit or (-) loss | 31,904 | 20,719 |
| C) TOTAL COMPREHENSIVE INCOME FOR THE PERIOD | 1,300,544 | 277,605 |
| Attributable to minority interests (non-controlling interests) | - | - |
| Attributable to the owners of the parent | 1,300,544 | 277,605 |
The accompanying notes 1 to 52 and appendices I through VI attached hereto form an integral part of the consolidated statement of recognised income and expense for the year ended 31 December 2021.
(*) Presented for comparison purposes only.
CONSOLIDATED STATEMENT OF TOTAL CHANGES IN EQUITY FOR THE YEARS ENDED 31 DECEMBER 2021 AND 2020 (Thousands of euros)
| Minority interests | ||||||||||||||
|---|---|---|---|---|---|---|---|---|---|---|---|---|---|---|
| Share capital | Share premium | Equity instruments issued other than share capital | Other equity | Retained earnings | Revaluation reserves | Other reserves | (-) Treasury shares | Profit or loss attributable to owners of the parent | (-) Interim dividends | Accumulated other comprehensive income | Accumulated other comprehensive income | Other items | Total | |
| Closing balance at 31/12/2020 | 269,660 | 1,184,265 | - | 7,482 | 3,051,137 | 4,806 | (14,778) | (3,641) | 317,123 | - | 148,103 | - | - | 4,964,157 |
| Effects of correction of errors | - | - | - | - | - | - | - | - | - | - | - | - | - | - |
| Effects of changes in accounting policies | - | - | - | - | - | - | - | - | - | - | - | - | - | - |
| Opening balance 01/01/2021 | 269,660 | 1,184,265 | - | 7,482 | 3,051,137 | 4,806 | (14,778) | (3,641) | 317,123 | - | 148,103 | - | - | 4,964,157 |
| Total comprehensive income for the period | - | - | - | - | - | - | - | - | 1,333,108 | - | (32,564) | - | - | 1,300,544 |
| Other changes in equity | - | (1,184,265) | - | (1,319) | 255,716 | (4,806) | 2,686 | 2,616 | (317,123) | (166,046) | - | - | - | (1,412,541) |
| Issuance of ordinary shares | - | - | - | - | - | - | - | - | - | - | - | - | - | - |
| Issuance of preference shares | - | - | - | - | - | - | - | - | - | - | - | - | - | - |
| Issuance of other equity instruments | - | - | - | - | - | - | - | - | - | - | - | - | - | - |
| Exercise or maturity of other equity instruments issued | - | - | - | - | - | - | - | - | - | - | - | - | - | - |
| Conversion of debt to equity | - | - | - | - | - | - | - | - | - | - | - | - | - | - |
| Share capital reductions | - | - | - | - | - | - | - | - | - | - | - | - | - | - |
| Dividends (or shareholder remuneration) | - | (1,184,265) | - | - | - | - | - | - | - | (210,769) | - | - | - | (1,395,034) |
| Purchase of treasury shares | - | - | - | - | 733 | - | - | (48,836) | - | - | - | - | - | (48,103) |
| Sale or cancellation of treasury shares | - | - | - | - | - | - | - | 51,452 | - | - | - | - | - | 51,452 |
| Reclassification of financial instruments from equity to liability | - | - | - | - | - | - | - | - | - | - | - | - | - | - |
| Reclassification of financial instruments from liabilities to equity | - | - | - | - | - | - | - | - | - | - | - | - | - | - |
| Transfers between equity components | - | - | - | - | 272,400 | - | - | - | (317,123) | 44,723 | - | - | - | - |
| Increases or decreases in equity arising from business combinations | - | - | - | - | - | - | - | - | - | - | - | - | - | - |
| Share-based payments | - | - | - | (1,319) | - | - | - | - | - | - | - | - | - | (1,319) |
| Other increases or (-) decreases in equity | - | - | - | - | (17,417) | (4,806) | 2,686 | - | - | - | - | - | - | (19,537) |
| Of which: discretionary transfer to welfare funds (only savings banks and credit cooperatives) | - | - | - | - | - | - | - | - | - | - | - | - | - | - |
| Closing balance at 31/12/2021 | 269,660 | - | - | 6,163 | 3,306,853 | - | (12,092) | (1,025) | 1,333,108 | (166,046) | 115,539 | - | - | 4,852,160 |
The accompanying notes 1 to 52 and appendices I through VI attached hereto form an integral part of the consolidated statement of total changes in equity for the year ended 31 December 2021
CONSOLIDATED STATEMENT OF TOTAL CHANGES IN EQUITY FOR THE YEARS ENDED 31 DECEMBER 2021 AND 2020 (Thousands of euros)
| Minority interests | ||||||||||||||
|---|---|---|---|---|---|---|---|---|---|---|---|---|---|---|
| Share capital | Share premium | Equity instruments issued other than share capital | Other equity | Retained earnings | Revaluation reserves | Other reserves | (-) Treasury shares | Profit or loss attributable to owners of the parent | (-) Interim dividends | Accumulated other comprehensive income | Accumulated other comprehensive income | Other items | Total | |
| Closing balance at 31.12.2019 (*) | 269,660 | 1,184,265 | - | 12,567 | 2,762,882 | 4,716 | 4,252 | (1,222) | 550,665 | (175,442) | 187,621 | - | - | 4,799,964 |
| Effects of correction of errors | - | - | - | - | - | - | - | - | - | - | - | - | - | - |
| Effects of changes in accounting policies | - | - | - | - | - | - | - | - | - | - | - | - | - | - |
| Opening balance at 1.1.2020 | 269,660 | 1,184,265 | - | 12,567 | 2,762,882 | 4,716 | 4,252 | (1,222) | 550,665 | (175,442) | 187,621 | - | - | 4,799,964 |
| Total comprehensive income for the period | - | - | - | - | - | - | - | - | 317,123 | - | (39,518) | - | - | 277,605 |
| Other changes in equity | - | - | - | (5,085) | 288,255 | 90 | (19,030) | (2,419) | (550,665) | 175,442 | - | - | - | (113,412) |
| Issuance of ordinary shares | - | - | - | - | - | - | - | - | - | - | - | - | - | - |
| Issuance of preference shares | - | - | - | - | - | - | - | - | - | - | - | - | - | - |
| Issuance of other equity instruments | - | - | - | - | - | - | - | - | - | - | - | - | - | - |
| Exercise or maturity of other equity instruments issued | - | - | - | - | - | - | - | - | - | - | - | - | - | - |
| Conversion of debt to equity | - | - | - | - | - | - | - | - | - | - | - | - | - | - |
| Share capital reductions | - | - | - | - | - | - | - | - | - | - | - | - | - | - |
| Dividends (or shareholder remuneration) | - | - | - | - | - | - | - | - | - | (87,757) | - | - | - | (87,757) |
| Purchase of treasury shares | - | - | - | - | (340) | - | - | (59,003) | - | - | - | - | - | (59,343) |
| Sale or cancellation of treasury shares | - | - | - | - | - | - | - | 56,584 | - | - | - | - | - | 56,584 |
| Reclassification of financial instruments from equity to liability | - | - | - | - | - | - | - | - | - | - | - | - | - | - |
| Reclassification of financial instruments from liabilities to equity | - | - | - | - | - | - | - | - | - | - | - | - | - | - |
| Transfers between equity components | - | - | - | - | 287,466 | - | - | - | (550,665) | 263,199 | - | - | - | - |
| Increases or decreases in equity arising from business combinations | - | - | - | - | - | - | - | - | - | - | - | - | - | - |
| Share-based payments | - | - | - | (5,085) | - | - | - | - | - | - | - | - | - | (5,085) |
| Other increases or (-) decreases in equity | - | - | - | - | 1,129 | 90 | (19,030) | - | - | - | - | - | - | (17,811) |
| Of which: discretionary transfer to welfare funds (only savings banks and credit cooperatives) | - | - | - | - | - | - | - | - | - | - | - | - | - | - |
| Closing balance at 31.12.2020 (*) | 269,660 | 1,184,265 | - | 7,482 | 3,051,137 | 4,806 | (14,778) | (3,641) | 317,123 | - | 148,103 | - | - | 4,964,157 |
(*) Presented for comparison purposes only.
CONSOLIDATED STATEMENT OF CASH FLOWS FOR THE YEARS ENDED 31 DECEMBER 2021 AND 2020 (Thousands of euros)
| 31.12.2021 | 31.12.2020(*) | |
|---|---|---|
| A) CASH FLOWS FROM OPERATING ACTIVITIES | 7,050,834 | 8,538,308 |
| Profit or loss for the period | 1,333,108 | 317,123 |
| Adjustments to obtain cash flows from operating activities | (182,434) | 860,390 |
| Depreciation and amortisation | 77,787 | 75,577 |
| Other adjustments | (260,221) | 784,813 |
| Net increase/(decrease) in operating assets | 5,615,322 | 4,355,843 |
| Financial assets held for trading | 1,879,514 | (1,689,408) |
| Non-trading financial assets mandatorily at fair value through profit or loss | 11,511 | (10,748) |
| Financial assets designated at fair value through profit or loss | - | - |
| Financial assets at fair value through other comprehensive income | (140,270) | (1,816,622) |
| Financial assets at amortised cost | 3,599,962 | 7,946,282 |
| Other operating assets | 264,605 | (73,661) |
| Net increase/(decrease) in operating liabilities | 11,877,918 | 11,837,451 |
| Financial liabilities held for trading | 2,314,196 | (1,441,548) |
| Financial liabilities designated at fair value through profit or loss | - | - |
| Financial liabilities at amortised cost | 9,971,341 | 13,296,974 |
| Other operating liabilities | (407,619) | (17,975) |
| Income tax recovered/(paid) | (362,436) | (120,813) |
| B) CASH FLOWS FROM INVESTING ACTIVITIES | (63,908) | (120,860) |
| Payments | (121,156) | (189,627) |
| Tangible assets | (18,304) | (17,911) |
| Intangible assets | (49,019) | (68,773) |
| Investments in joint ventures and associates | - | - |
| Subsidiaries and other business units | (53,833) | - |
| Non-current assets and liabilities classified as held for sale | - | (102,943) |
| Other payments related to investing activities | - | - |
| Proceeds | 57,248 | 68,767 |
| Tangible assets | 7,685 | - |
| Intangible assets | - | - |
| Investments in joint ventures and associates | - | 228 |
| Subsidiaries and other business units | - | - |
| Non-current assets and liabilities classified as held for sale | 49,563 | 68,539 |
| Other proceeds related to investing activities | - | - |
| C) CASH FLOWS FROM FINANCING ACTIVITIES | 341,847 | 219,823 |
| Payments | (459,605) | (186,761) |
| Dividends | (210,769) | (87,758) |
| Subordinated liabilities | (200,000) | (40,000) |
| Redemption of own equity instruments | - | - |
| Acquisition of own equity instruments | (48,836) | (59,003) |
| Other payments related to financing activities | - | - |
| Proceeds | 801,452 | 406,584 |
| Subordinated liabilities | 750,000 | 350,000 |
| Issuance of own equity instruments | - | - |
| Disposal of own equity instruments | 51,452 | 56,584 |
| Other proceeds related to financing activities | - | - |
| D) EFFECT OF EXCHANGE RATE CHANGES | - | - |
| E) NET INCREASE (DECREASE) IN CASH AND CASH EQUIVALENTS(A+B+C+D) | 7,328,773 | 8,637,271 |
| F) CASH AND CASH EQUIVALENTS AT BEGINNING OF PERIOD | 15,044,317 | 6,407,046 |
| G) CASH AND CASH EQUIVALENTS AT END OF PERIOD | 22,373,090 | 15,044,317 |
| Of which: Interest received | 1,317,773 | 1,413,935 |
| Of which: Interest paid | 198,439 | 168,193 |
The accompanying notes 1 to 52 and appendices I through VI attached hereto form an integral part of the consolidated statement of cash flows for the year ended 31 December 2021.
(*) Presented for comparison purposes only.